Trading with your intuition and gut feelings is a recipe for disaster. What we need is a systematic approach to trading that revolves around risk and reward. For this we need to learn a bit of predictive modelling. As long as you trade with a seat of the pants method, you going nowhere near your financial goals. As a new trader you need to learn a lot of things. Trading has evolved into a very competitive sophisticated game. The key to success in trading lies in training, research and study. Don’t hesitate when it comes to looking at new trading approaches. Learning how to code your own trading strategies is a big plus now a days. So don’t hesitate to learn how to program. Most of the popular programs have programming languages that you can use to code trading strategies. For example TradeStation has got Easy Language. MetaStock has its Formula Language. MT4 has got MQL4. Did you read the post on how to use fuzzy logic in trading?
New traders start by learning a few trading strategies based on moving averages. They then learn around 10-20 candlestick patterns that they are told by the gurus have the potential to predict the market. New traders also come across Elliott Waves and start believing the gurus that Elliott Waves can be used in predicting the markets. They just need to follow 5 wave patterns. Once a 5 wave pattern ends, a new 5 wave pattern starts and they can latch onto that 5 wave pattern to make big pips in the market. Soon new traders also start learning Fibonacci Retracement and how it can predict the market. But knowing all these things doesn’t change their bottom line. They keep on losing even though everytime they correctly predict the Elliott Waves and the Fibonacci Retracement. So where they are making the mistake? Read this post on EURNZD sell trade with 5 pip SL and 500 pips TP.
What we need a system or a method that keeps us away from entering the waters when the chances of high winds are great. If we can keep out of the market during times when the market volatility is very high, we can avoid losing trades. Let’s develop a simple market scoring system that measures the trend and the volatility and can guide us about the market sentiment on a daily a basis. First we develop a Score Card Number Based Trend Trading System that will take the emotions out of trading and make it more of a mechanical process. After that we develop a Volatility Score Card System. Read this post on USDJPY sell trade that made 700 pips with 21 pip stop loss.
In real life we tend to follow our intuition and instincts. But when confronted with fast paced events, we make wrong decisions. Suppose you have decided to take part in the Formula One racing. First you need learn how to drive a sports car. So you buy a sports car. You are very happy and you take it out for a test drive. You are driving very fast and enjoying a lot. Suddenly a bend comes in the road. Your speed is very high. Your instincts are not well trained for now to tell you what to do. Suddenly you see a lorry coming from the opposite direction. What to do? Apply the brakes? Suddenly you see another car following you closely in the rear view mirror. You have no idea. Read this post on the only candlestick pattern that you will ever need.
It was just an example on how your intuition and instincts fail you when you face fast paced events. Most Formula One sports cars have gadgets that tell the driver when the bend is coming and how to avoid obstacles. This is precisely what trading has become these days. You can compare trading to Formula One racing. Things are highly competitive. You need a lot of training and experience to become a successful trader. Consider yourself driving a sports car when you are trading the markets. Instincts have no place in today’s world of trading. You need a score based system that tells you what to do before you do it. Keep this in mind. Just like a sports car, today’s markets are difficult to navigate so you need a method that can reduce the madness that you will face on daily basis when trading today’s electronic markets. Download your copy of Traders World Magazine.
You need to develop a structural approach to trading the markets. Structural approach doesn’t mean that you will win everytime. However with a good structural approach you can keep your emotions under check when taking trading decisions and improve upon your winrate as compared to trading based solely on your instincts and intuition by looking at the charts and technical indicators. Trading based on gut feelings and good intentions will only result in losing trade after losing trade. I will not go into the details of how technical analysis is real time as compared to fundamental analysis and can help us develop a structural approach to market sentiment analysis. Technical analysis is a good tool for real time risk management and profit taking. What we need to know is whether the buyers are in control or the sellers are in control. If buyers are in control, prices will tend to rise and if sellers are in control prices will tend to fall. If no one is in control, market will move sideways.
A Simple Trend Scoring System
Trends are to traders what waves are to the surfers. Just like a surfer who waits for the wave to rise, you also wait for a trend to start. Once the wave rises the surfer jumps on it and rides the waves as long as it is there and gets down just before it crashes. This is exactly what a trend trader does. Trend trading is where traders make money. Ride as long as the trend lasts. This is what every traders wants to do. Now we want to develop a trend scoring system that can guide us in making our trend trading decisions. The purpose of developing a trend scoring system is to reduce the human bias in decision making as much as possible. There is always a different trend going on each timeframe. When the trend on the higher timeframe is up while that on the lower timeframe is down, market will make a correction of what you call a retracement before it starts moving in the direction of the trend on the higher timeframe which is up. Watch these 3 videos on momentum trading strategies.
This is what we need to do: Score the trend on different timeframes and then add the scores together and see the overall market sentiment. So this is what we are going to do. We will start with the weekly timeframe and score the trend between +3 and -3. If the trend on weekly is +3, it means a strong uptrend and if it is -3, it means a strong downtrend. After that we score the daily timeframe and then the H4 and H1 timeframes. Once we have scored these timeframes we add the scores and divide it by the number of timeframes to get an average score. We will discuss whether we need to give more weight to the higher timeframes or not later on. Of course when we use the intraday timeframes the score can change with the close of each new intraday candle. The important question is what will be the scoring method. Let’s discuss the scoring method.
- We will use the closing price for scoring.
- Moving average is a widely used technical indicator. It just averages the price over a sliding window with a certain period. Moving averages can also be used as a dynamic support and resistance in the market. We will use the 21 period Simple Moving Average (SMA) for short term moving average and 55 SMA as the long term moving average. Most trend trading system use two moving averages. So our trend scoring method also uses two moving averages one 21 SMA and the other 55 SMA.
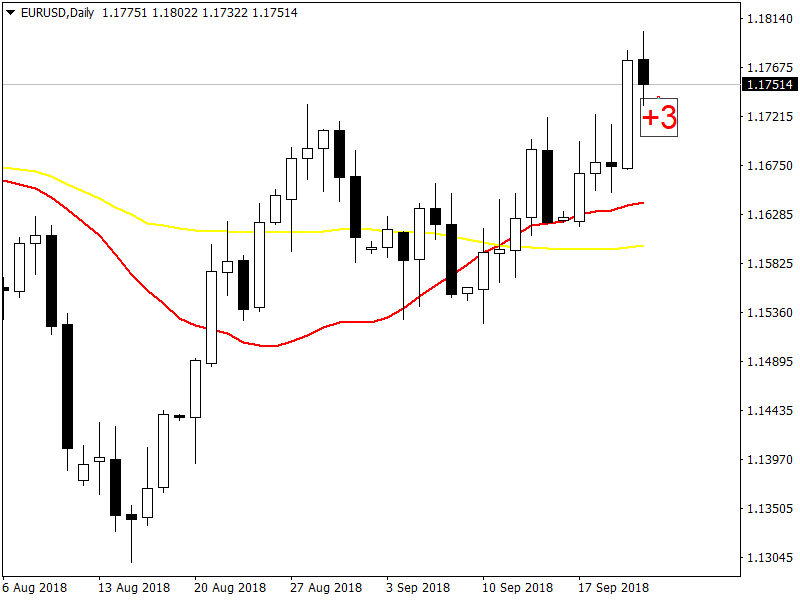
- When short term moving average 21 SMA is above the long term moving average 55 SMA, and the price close is above both the moving averages we score the trend as +3. When the price close is between the two moving averages we give it a score of +1 and when the price is below both moving averages we give it a score of -2. You can see in the screenshot of EURUSD Daily Chart below 21 SMA(red) is above the 55 SMA (yellow) and the price close is above both the SMAs. So we score the trend on daily chart as +3.
 4
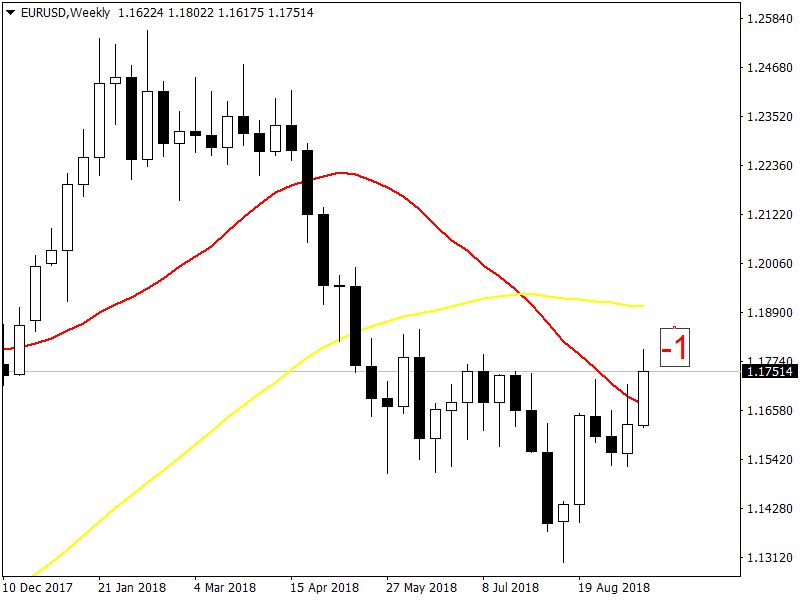
4 - When short term moving average 21 SMA is below the long term moving average 55 SMA and the price is above both the moving averages we give it a score of +2. When price is between the two moving averages we give it a score of -1 anwhen the price is below both the moving averages we give it a score of -3. Below is the corresponding EURUSD Weekly Chart screenshot. 21 SMA (red) is below the 55 SMA (yellow) and price is between the two SMAs. So we score the weekly trend as -1.
This was the scoring method for determining the general trend. We add all the scores that range between +3 and -3. For now we just add the trend on the daily timeframe which is +3 with the weekly which is -1 and get +2. Watch this documentary on the trading techniques of an investment bank. Now we bring in the candlestick patterns in the picture. As traders we know candlestick patterns have some predictive power.
Candlestick Patterns Scoring System
Most of the time candlestick patterns are vague and imprecise. We need to quantify these candlestick patterns so that we can score them in an objective manner. There are many chart types that you can use like the line chart, the bar chart and the candlestick chart. There is a little difference between the bar chart and the candlestick chart. In candlestick charts, we color the body of the candle which makes the candlestick more visual as compared to the bar. Looking at the candlestick chart you can tell who is in control of the market. if the candlestick that closed is bullish you can say buyers were in control. Similarly if the candlestick that closed is bearish you can say sellers were in control. You can also use the candlestick chart to identify the key areas of support and resistance as well as tell whether the volatility in the market was increasing or decreasing.
Candlestick Upper Shadow
Each candlestick has a top shadow. This is a line protruding from the top of the candlestick body and is also known as the upper shadow. Top shadow gives you the highest price that was achieved during the candlestick period trading session. Now keep this in mind the candlestick chart doesn’t tell you when this high price was made. It just gives you the high price that was made during the trading session. In highly volatile markets, high price can be made for just a few seconds before the price starts falling. Right now we don’t need this information.
Candlestick Lower Shadow
Just like the top shadow we have a bottom shadow also known as the lower shadow. This is the line protruding from the lower side of the candlestick body. Lower shadow gives you the lowest price that was made during the trading session. Both the upper shadow and the lower shadow tell you about the volatility in the market. If the shadows are small, the volatility in the market is small. On the other hand, if you find big shadows attached to a candlestick, it means the market is experiences high volatility. Most of the time you will find big shadows being made around the time of the new release in the market.
Candlestick Body
Candlestick body is the middle rectangular part of the candlestick. It shows the open and close price during the trading session. If the candlestick is bullish and painted white, close price will be higher than the open price so the candle body lower line will be the open price and the upper line will be the close price. In the same manner, if the candlestick is bearish, the open price will be higher than the close price and the candle body upper line will be the opening price and the candle body lower line will be the close price. Usually we paint the candle body while if the price is bullish during the trading session and we paint it black if the price is bearish during the trading session. We can also use other colors to depict bullish and bearish candles. Just choose a pair of colors and then be consistent with it.
When the candle body is bullish this is an indication that the buyers had been in control during the trading session. Similarly when the candle body is bearish, it means the sellers have been in control during the trading session. There can be occasions when the upper shadow might be missing or the lower shadow might be missing or both are missing. This happens when the closing price is equal to the high or the low. Doji is a very important candlestick pattern that indicates indecision in the market. Doji pattern forms when the open and the close price are almost the same. So when the trading session opens, price moves higher cannot sustain high price falls makes a lower cannot sustain it and returns and closes where the open was it means the buyers and sellers are in a tug of war with no one in control.
Candlestick Pattern Scoring Template
As I said, we need to quantify the candlestick pattern so that we can develop a objective scoring system. Below I give you the candlestick pattern scoring template:
- Subtract the closing price from the opening price and take the absolute. This is the body length. We take the absolute because opening price can be higher than the closing price which will give us the body length as negative. We just need the magnitude so we take the absolute.
- We need to calculate the length of the candle body in pips. Multiply the body length with 10000. This gives us the candle body length in pips.
- In case of a bullish candle, if body length less than 50 pips we score it as 0. If the body length is between 50 and 100 pips, we score it as +1 and if the body length is greater than 100 pips we score it as +2.
- In case of a bearish candle, if the body length is less than 50 pips we score as 0. If the body length is between 50-100 pips we score it as -1 and if the body length is greater than 100 pips we score it as -2.
Let’s calculate the candlestick scores for the EURUSD weekly daily. Just look at the screenshot above with +1 score written on it. On the weekly timeframe, open was 1.16224 and the closing was 1.17490 so the candle body length is 0.01266 which translates to 126 pips. So we give it a +2 score. In the case of the daily candle the the open is 1.17751 and the close is 1.17514 so the candle body length is just 23 pips so we also score it as 0. So the total candlestick score for the weekly and the daily timeframes is +2.
Volume Scoring System
Most of the time we forex traders ignore volume. There is no volume information provided by the forex brokers. It is just the number of tick in the given time period. Tick is just one single trade. But a tick doesn’t provide you information on the size of the trade. We can use the number of ticks as a proxy for the volume. On MT4, you will find the On Balance Volume (OBV) indicator. We use OBV because it is a composite indicator that incorporates both price and volume changes. We quantify OBV trend relative to the price trend. This is what we do. We subtract current OBV value with the OBV value 10 periods back. We apply 20 period EMA to the closing price and compared the EMA 20 current value with EMA 20 value 10 periods back. This is the volume score card:
- If both OBV and EMA trend higher, we score it as +2.
- If EMA is rising and OBV is falling we score it as +1.
- If EMA is falling but OBV is trending up, we score it as -1.
- If both OBV and EMA are trending down, we score it as -2.
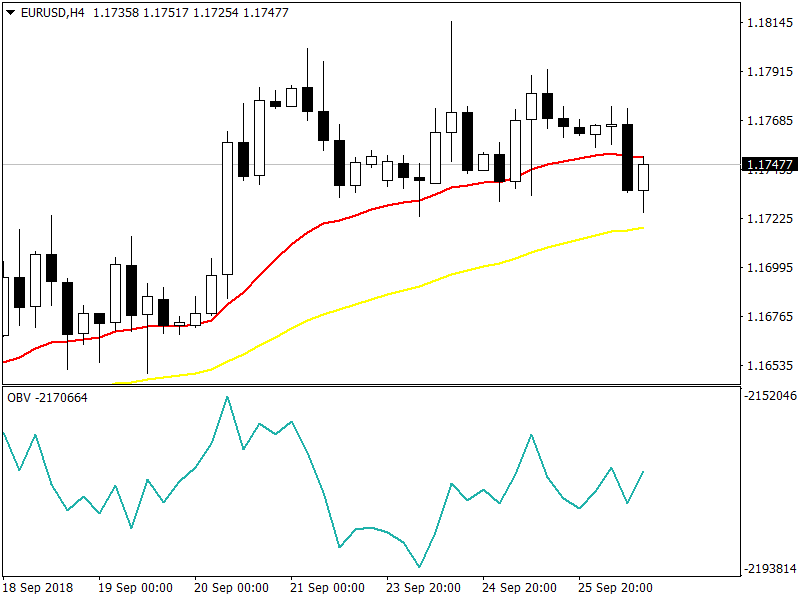
Above is EURUSD H4 screenshot. In the bottom window you can see the OBV indicator. Use the above criteria to score the trend on H4 timeframe.
Volatility Scoring System
Volatility is a measure of uncertainty in the market. What we are doing is not predicting the price but rather avoiding a careless prediction of price and replacing it with thoughtful price projection. High volatility means bigger swings in the market. When the volatility in the market increases, you will find candlesticks with bigger wicks and bigger bodies being formed. Now this will surprise you that the market behavior when price rises is totally different as compared to market behavior when price falls. This is a reminder to you that you should not use the exact same trading strategy for going and short. You will need to modify your trading strategy so that it caters to the bullish as well as the bearish market. In simple terms, price rises slowly and falls rapidly. In technical terms, volatility in the bullish market is lower than the volatility in the bearish market. Read this post on what is market spoofing.
Most traders are pretty much familiar with moving averages. Moving averages are uses in many trading systems despite their lagging behavior they are still useful. When it comes to volatility, how do we measure before we start using it in our trading system. Volatility is usually measured as a standard deviation. Range is also used as a volatility measure. Range is simply the difference between the high and low of a candle. But the problem with range measure is that it can easily get skewed if there is a big extreme move in the market for a short time. Another measure that we can use for volatility is the Average True Range (ATR). ATR indicator is available on MT4 platforms. For now we will stick with the standard deviation which is the most popular measure of volatility. We use the following formula to measure standard deviation $$\sigma$$:
$$\sigma^{2}=\frac{1}{n-1 }\sum_{i=1}^{n}(P-P_{mean})^{2}$$
Now keep this in mind that the above formula for standard deviation is for a normal distribution. The important question is: Is stock prices normally distributed. Normal distribution extends from the negative infinity to the positive infinity while we know for sure that stock price cannot go below zero. At zero price the company and its stock ceases to exist. Stock prices are definitely not normally distributed but most of the time we assume stock prices to be log normally distributed. You need to keep this in mind. Volatility cannot be negative. It makes no sense. We can only talk of high volatility and low volatility. So we use a scale 0-10 for scoring volatility. When we have low volatility, we should have the score near 0 and when we have very high volatility the score should be close to 10.
- When we are using past prices in the above formula, we are calculating the historical volatility. We use historical volatility in the volatility scoring formula. For the volatility scoring formula we define variation coefficient (VC) which is just the ratio of 20 period standard deviation with 50 period simple moving average. We multiple this ratio with 100 to convert into a percentage. If the VC is less than 2% we score it 0. If VC is between 2-4% we score it +1. If it is between 4-6% we score it +2. If it is between 6-8% we score it +3 and it it is above 8% we score it +4.
- Now we need to know the expected volatility. You must have heard about the VIX index which is calculated from the options trading data. In forex, we don’t have VIX available. But there is a substitute known as William’s VIX FIX. You can easily download the William’s VIX FIX MT4 indicator and use it as a substitute for the VIX index. If VIX FIX is less than 20%, we score it 9. if VIX FIX is between 20-40%, we score it as +1 and if VIX FIX is above 40%, we score it as +2.
Now we add the volatility score. Higher volatility score means more uncertainty in the market and potential for wide swings. This is a general observation that has been found to hold most of the time. Low volatility is also followed by a breakout and high volatility. Bollinger Bands have been traditionally used for measuring volatility in the market. When the bands constrict and come very close, it means the market is moving in a very narrow range and soon a breakout will take place. If you need the VIX FIX indicator, you join my newsletter and send me an email. I will send you the VIX FIX indicator.
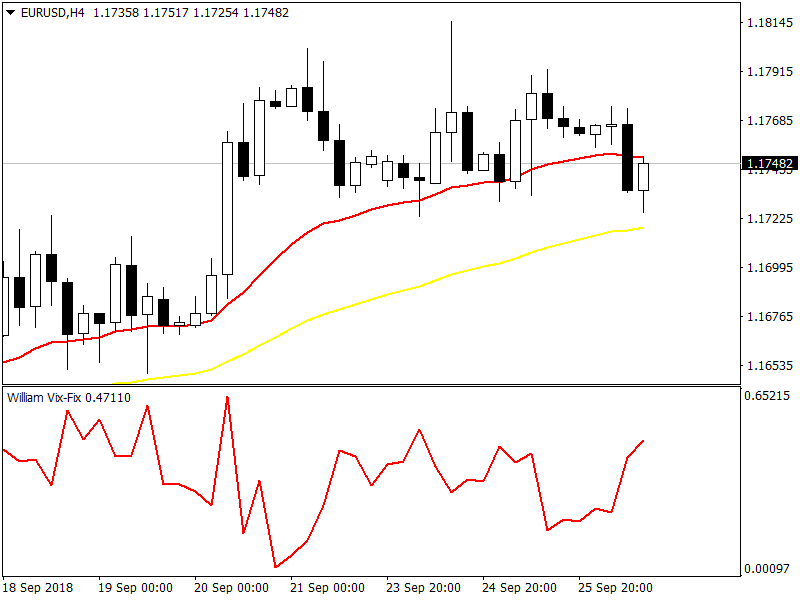
In the above screenshot, you can see the William VIX FIX Indicator that we will use as a proxy for the VIX index. Read this post on how a Japanese day trader makes $34 million in one day.