In the last post we started developing a machine learning artificial intelligence automated trading system that can be used to trade stocks, currencies and commodities. We started off by talking about how the increased number crunching power of computers is being used by data analysts to make powerful predictions. Data analysts is the new man in the town and is in high demand everywhere. Machine learning is a new subject that combines statistical methods with artificial intelligence and information technology to data mine big data, find patterns and then make predictions. Our goal is to develop a daily trading system that will automatically analyze the data and then make predictions about the market direction with buy/sell recommendations. Before you continue reading below you should the first part of this post on designing a Machine Learning Artificial Intelligence Automated Trading System.
In the first post we talked about how to develop a machine learning automated trading system. You need to know a little bit of coding and number crunching in order to successfully design such a system. There are 2 languages that you should learn if you want to become good at machine learning. The 2 languages are R and Python. Python is a very powerful language that is being used in a wide range of areas that includes machine learning algorithmic trading. R is a language that has been solely developed to do statistical learning. Both R and Python are FREE. In this project we will solely focus on using R.
In the last post we showed you how you are going to read the data into R. Data reading and formatting is one of the most important things that many new data analysts fail at. Learn and master your data because it is the data that is going to help you find the high probability patterns that will tell you when to buy/sell.
Candlestick Patterns Are No More Reliable
Algorithmic trading is the new thing. Traditional candlestick patterns have no meaning now a days. Try to trade the traditional candlestick patterns like engulfing or the harami and you will get clobbered by the market. Why? Hedge funds and other big boys in the market have algorithms that trapped the retail traders who trade these patterns.
Not all candlestick patterns work equally well. Their huge popularity has lowered reliability because they’ve been deconstructed by hedge funds and their algorithms. These well-funded players rely on lightning speed execution to trade against retail and traditional fund managers who execute technical analysis strategies found in popular texts. In other words, they use software to trap participants looking for the high odds bullish or bearish outcomes. However, reliable patterns continue to appear, allowing short- and long-term profit opportunities.
Traditional candlestick patterns are not working anymore. Does this means candlestick patterns are dead? No, it only means that we need to use candlestick patterns in a non traditional manner. We use candlestick patterns non traditionally and have achieved very good results. More on that in future posts on how to use candlestick patterns non traditionally.
The most important question that every trader wants to know daily is how much the market is going to move and in which direction. If you can answer this question about the size of the market move and the direction you have solved 80% of the your trading uncertainty. Our automated trading system should be able to predict how much a particular stock or currency pair is going to move and in which direction. So we need to make prediction on the daily basis how much the market is going to move today and in which direction. In short we develop an indicator that makes this prediction.
In the last post we showed you how to read the data. We showed you how quantmod R package allows you to download the data for any stock symbol from the web. Read the last post again and learn how you can easily download the data for any stock symbol using quantmod. Quantmod uses Yahoo Finance to download the data in the proper format. Quantmod also lets you make candlestick charts and do much more. We also showed you how can easily download the currency pair data from MT4 using the History Center. Since we trade forex more, our focus will be on currency trading. But as said in the start of this post this automated trading system should be able to trade stocks, currencies and commodities. Why? Because this system just downloads the candlestick data and then analyzes that data to make predictions. So it doesn’t matter whether it is stocks, currency pairs, gold, oil or any other commodity, as long as we have candlestick data, the trading system should be able to make predictions.
Developing the Automated Trading System Indicator
Let’s start with forex. We can tweak the system for stocks and commodities as well. First let’s develop it for forex. We will only trade if the currency pair is going to move 150 pips in 1 day. Our system is going to tell us what is the probability of the pair moving more than 150 pips today. On pairs like GBPUSD, GBPJPY and GBPNZD it is very much possible to get a daily movement of 150 pips. On pair like EURUSD, NZDUSD, AUDUSD, USDJPY, USDCHF and USDCAD, 150 pips movement may happen in 2-3 days. So if we trade the GBPUSD, GBPJPY, GBPNZD pair we will choose the setting of 1 day otherwise we will choose the setting to 3 days for other pairs. So let’s start with GBPUSD.
#load the quantmod package
library(quantmod)
#Reading the csv file from E drive
quotes <- read.csv(“E:/MarketData/GBPUSD1440.csv”, header=FALSE)
#Converting the data frame into an xts object
quotes <- as.xts(quotes[,-(1:2)], as.Date(paste(quotes[,1]),format=’%Y.%m.%d’))
#Naming the columns
colnames(quotes) <-c(‘Open’,’High’,’Low’,’Close’,’Volume’)
Now we want price to move p% in 1 day. Our trading system should tell us that whether this p% movement is attainable in the next 1 day or not. As said above we can choose our own p% level and the days in which this target can be achieved. For now we are interested in getting a 150 pip movement in one day as we want to trade GBPUSD pair and we know it is easy for this pair to move more than 150 pips. The formula below is going to achieve that!
#T indicator that calculates whether price is going to move 150 pips in the coming day or not
T.ind <- function(quotes, tgt.margin = 0.015, n.days = 1) {
v <- apply(HLC(quotes), 1, mean)
r <- matrix(NA, ncol = n.days, nrow = NROW(quotes))
for (x in 1:n.days) r[, x] <- Next(Delt(v, k = x), x)
x <- apply(r, 1, function(x) sum(x[x > tgt.margin | x < tgt.margin]))
if (is.xts(quotes))
xts(x, time(quotes))
else x}
The above formula is going to calculate the T indicator that is going to tell us how much price is going to move in the next 24 hours. Let’s plot this T indicator below a candlestick chart and see how it works.
#drawing the candlestick chart of daily candles for the last 3 months
candleChart(last(quotes, “3 months”), theme = “white”, TA = NULL)
#draw the T indicator just below the candle chart
addT.ind <- newTA(FUN = T.ind, col = “red”, legend = “tgtRet”)
High values of this indicator means chances of GBPUSD moving 150 pips in up direction are high so we should only look for buy trade for that day. In the same manner low values of this indicator means the chances of GBPUSD pair moving 150 pips in the down direction are high and we should only look for a sell trade for that trade. Avoiding a buy trade on the day when the chances for the market are high to move in the down direction is definitely going to reduce your percentage of your losing trades.
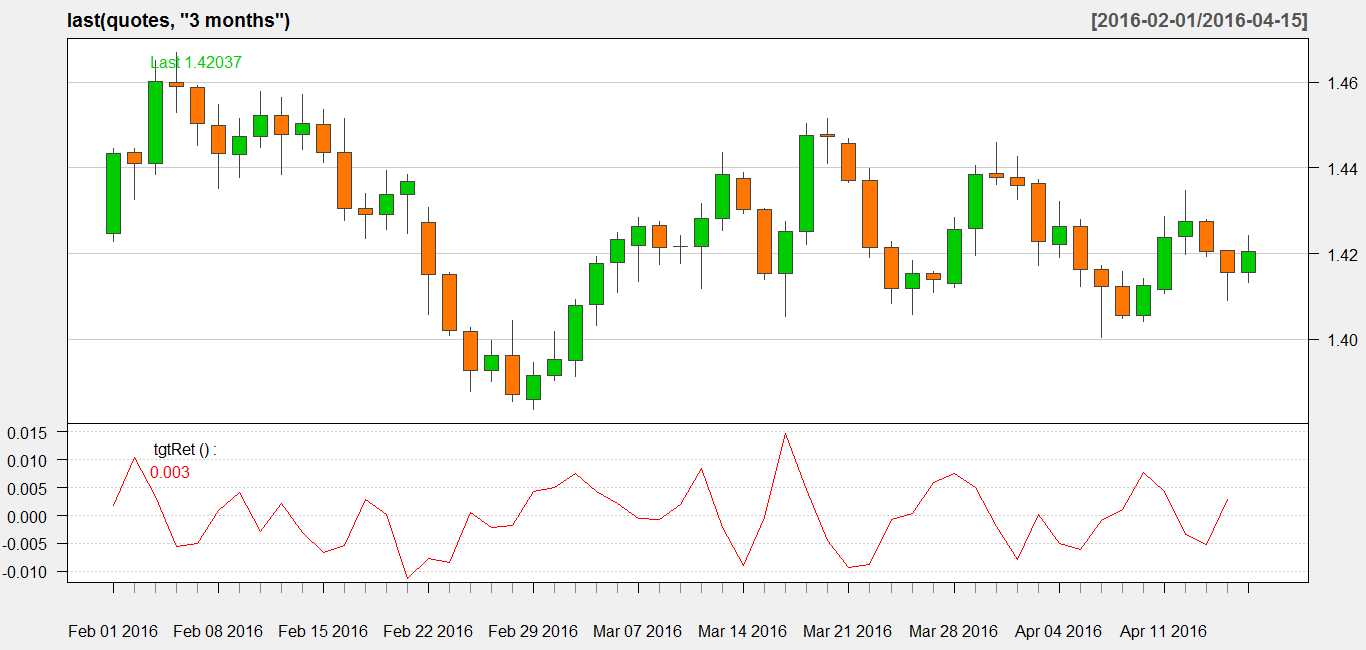
As you can see in the above chart, High positive values are showing up movement and high negative values are showing down movement.
In the next post we are going to develop a neural network that is going to predict the values of this indicator. Right now this indicator has be drawn using past values of price. We need to predict what is going to happen in the coming day. For day we need to develop a neural network that trains itself on the past values and then makes prediction for the coming days.
Developing the neural network will be the most complex part of designing our automated trading system. The most important question that we need to answer is what type of neural network should we build. Will a multi layer perceptron aka MLP help us? So it will important for us to first decide on the type and architecture of the neural network.