In this post, I will explain my simple swing trading system in detail. Swing trading is much better than scalping. As a scalper, you need to be constantly glued to your computer for hours daily. But in swing trading, you just need 15-20 minutes daily to check the charts and make a judgement where the price is going. The timeframe that I use for swing trading is H4. A trade on this timeframe can continue from a few days to a few weeks. On average a swing trade on this timeframe lasts around 10-15 days. When you are trading on higher timeframes like H4 and D1, Economic News Releases like NFP become irrelevant. I will show you how in a future post. Each trade can make something like 300-500 pips. If you know how to correctly and properly pyramid your position, you can make a very high return from just one trade. I will show you how to do pyramiding properly in the future posts.
So this is what I do. I look for the divergence pattern to appear simultaneously on the three oscillators MACD, Stochastic and RSI. When I spot a bullish divergence pattern, I go long. I will continue in this trade until and unless I spot a bearish divergence pattern appearing. When I spot a bearish divergence pattern, I close the long trade and open a short trade and continue in the short trade as long as there is no bullish divergence again. So let’s get started! Take a look at the following screenshot!
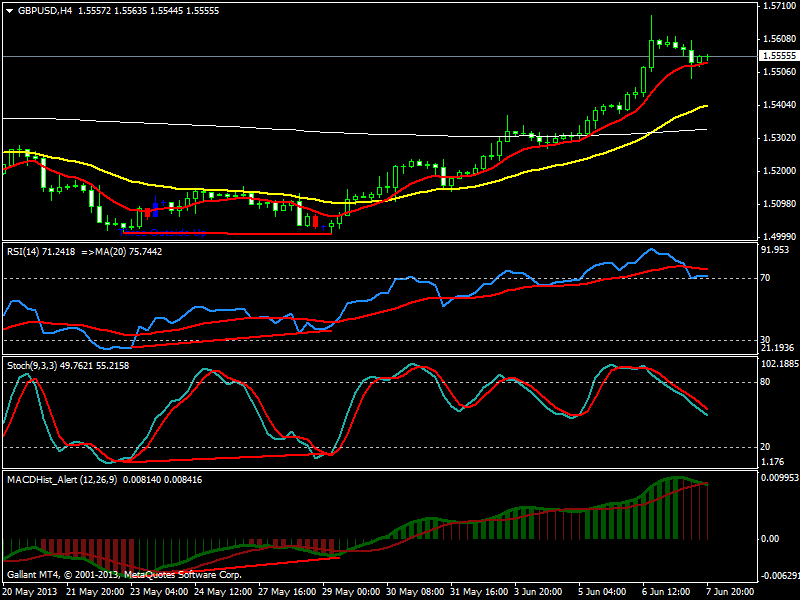
As you can see the three oscillators are showing bullish divergence simultaneously. Now if you take a closer look you also find a double bottom pattern being formed on both H4 and the D1 timeframe.
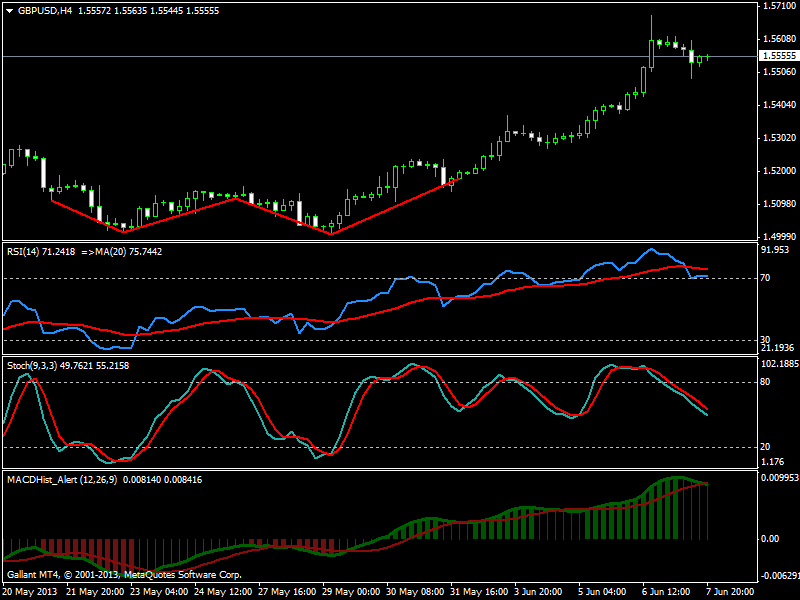

When the Double Top or the Double Bottom Pattern gets formed, it is considered to be a pretty strong trend reversal signal. So the bullish divergence pattern is being confirmed by the Double Bottom Pattern. The important question is how do we make the entry. We will be using the H1 timeframe to make the entry. We will make the entry by drawing a minor trendline on the H1 timeframe and wait for the price action to break it. Take a look at the following screenshot.
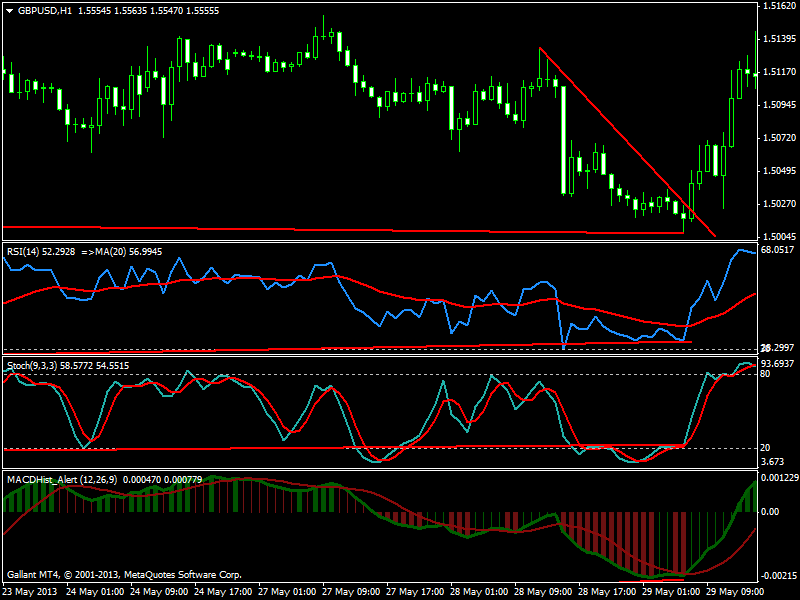
As you can see we have drawn a minor trendline on H4 timeframe and we will enter the market when price breaks it and closes above this trendline which it does. Price found support at 1.50075 and broke the minor trendline on H1 timeframe just after one candle. We enter into a long trade at 1.50311 and our stop loss is at 1.50000. So our risk for this trade is 30 pips. This was 29th May 2013.
Today is 6th June 2013 Saturday when I am writing this post. Yesterday was the NFP Report release day. Since no bearish divergence pattern had appeared on H4 timeframe, I did not close the trade. NFP Report is irrelevant for us. We will only close the trade when a bearish divergence pattern appears. Since the pattern was still bullish at the time of the NFP Report release, it meant price will not go down much which it didn’t. Right now the trade is in profit of around 500 pips which is not bad. It seems that the market will take a few more days before a bearish divergence pattern appears. I will update you with another post when I close the long trade and open a short trade.
Now as you can see, we made more than 500 pips in just 7 days and it did not take us more than 15-30 minutes daily to monitor the charts and decide what to do. Since there is no bearish divergence appearing, we will continue in the trade as long as this pattern does not appears. So trading on H4 timeframe is much easier and simpler as compared to trading on the lower timeframes. If you want a life as a trader, you need to become a swing trader and choose H4 or D1 timeframe for trading. Forex Mentor PRO is a good service that teaches how to trade on H4 timeframe. If you want to learn how to trade on H4 timeframe, you should try this service for a few months and see how quickly your trading improves.