In this post, I will discuss my forex divergence trading system for H1 timeframe. Basically I am a divergence trader. I have the same system for scalping as well as swing trading. When I want to swing trade, I trade on H1 and H4 timeframe and when I want to scalp, I trade on the M15 timeframe. I also use this same system for trading important economic news releases like the NFP Report. In future posts, I will show in detail how I use the same system for scalping plus how I use this same system for trading important economic news releases like the NFP report.
Now before you proceed further, I want you to download these 2 PDFs FREE and go through them. These 2 PDFs explain in detail how to use Moving Averages and Candlestick Patterns in your trading plus how to identify Divergence Patterns. Since I use moving averages, candlestick patterns and divergences in my trading a lot, you should go through these 2 PDFs first before you read the rest of the post below. I hope you have gone through the 2 PDFs now, so let’s discuss this forex divergence system in detail. This time we will be trading on the H1 timeframe. Take a look at the following screenshot!
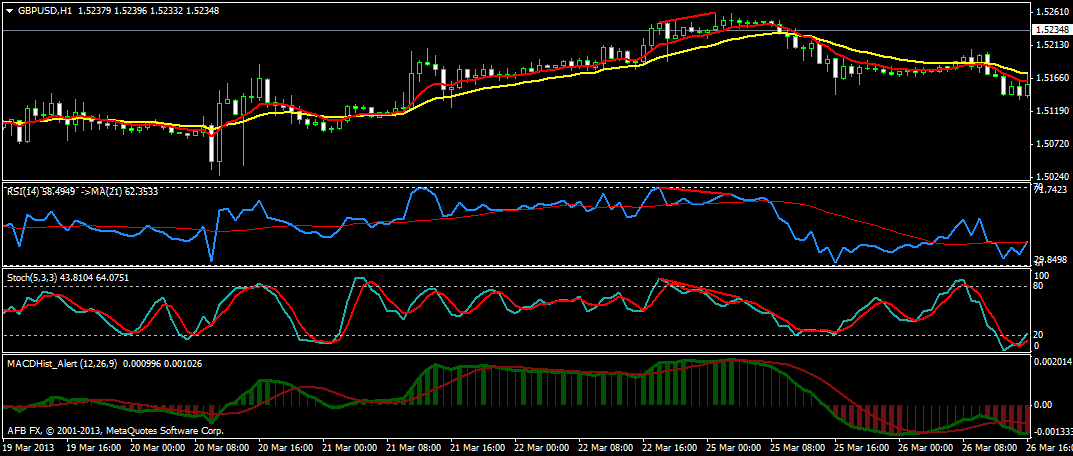
As you can see a nice bearish divergence pattern appeared on the GBP/USD. H1 timeframe on 25th March. RSI and the Stochastic are showing bearish divergence while MACD is not showing any divergence. For our purpose divergence appearing on any two oscillators is a strong signal. So we start planning for a short trade. After spotting the bearish divergence on the H1 timeframe, we shift to the M15 timeframe in order to find a better entry. We draw a minor trendline on the M15 chart and wait for the price action to break it in the down direction. Take a look at the following screenshot!
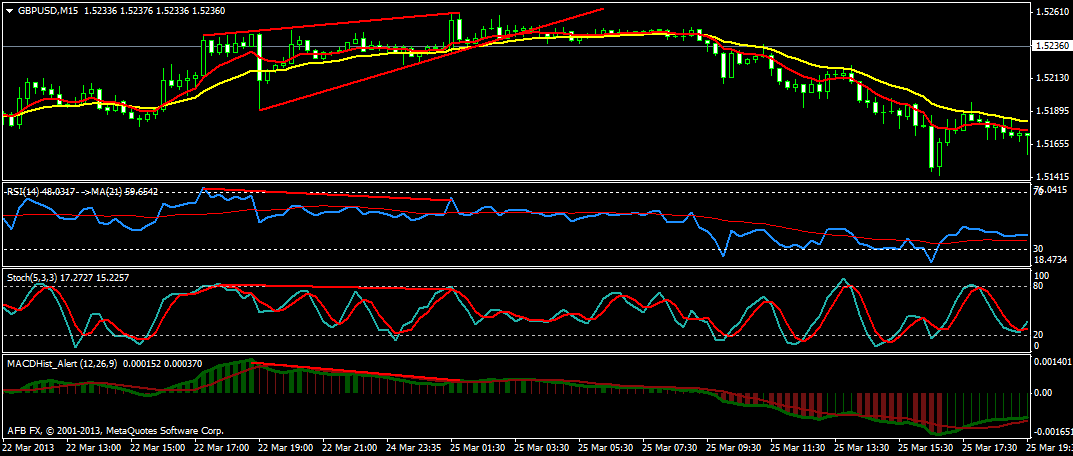
On M15, all the three oscillators are showing bearish divergence. The market top is at 1.5260. After 10 candles the minor trendline is broken as is clear from the above screenshot. We enter into a short trade at 1.5248. Our stop loss is at 1.5263 and our risk for this trade is 15 pips. If we had drawn the minor trendline on the H1 timeframe, our entry would have been around 1.5230 and our risk would have been 38 pips. So by using a lower timeframe, we have been able to reduce the risk by 23 pips. It is important for you to reduce the risk. Lower risk should always be preferrable. On H1 timeframe, try to keep risk lower than 20 pips. If you find an entry with a risk of more than 30 pips, just skip that trade.
Now this is what we will be doing. We entered on a bearish divergence on H1 timeframe. We will continue in the trade as long as no bullish divergence appears on H1 timeframe. On H1 timeframe, an average market move can be from 100-200 pips. So we expect to make at least 100 pips. If we make 100 pips, our reward to risk ratio will be 6.5:1 which is very good. A trade on H1 timeframe can continue from 1-3 days on average. So we continue in the trade. On 27th, after two days we spot a bullish divergence pattern forming on H1 timeframe. Take a look at the following screenshot.
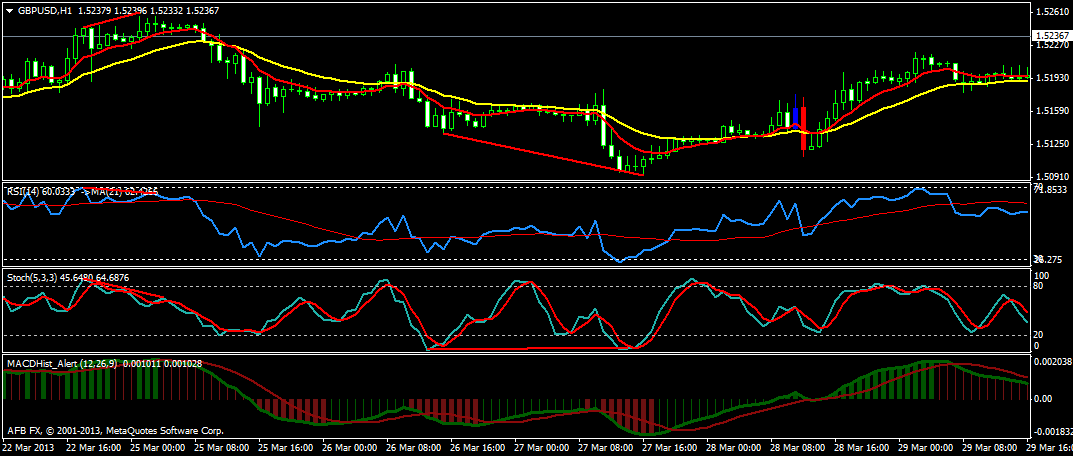
This time only the Stochastic Oscillator is showing a clear bullish divergence pattern. RSI is also showing divergence pattern but it is not very strong. When you spot a divergence pattern on anyone of the three oscillators, plan to exit the market. So we once again shift to the M15 timeframe and see what’s happening on it. Take a look at the screenshot below!
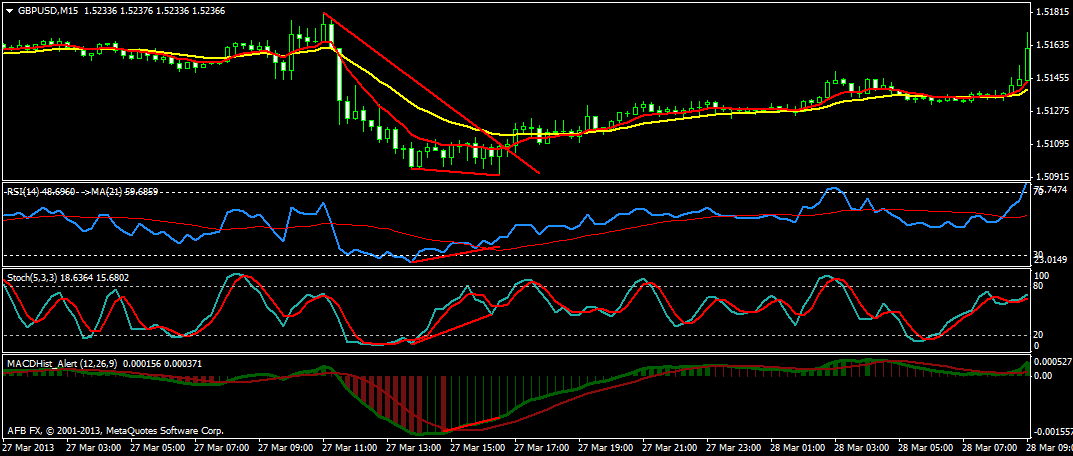
On M15, all the three oscillators are showing bullish divergence. So we have a strong signal to close the short trade. We close it at 1.5098 making a total of 250 pips in just 2 days. We again draw a minor trendline on M15 timeframe and wait for the price action to break it. Price soon breaks the minor trendline and we go long at 1.5112. Our stop loss is a few pips below the bottom at 1.5092. So our risk for this long trade is 20 pips. On 29th I closed the trade at 1.5221 on the appearance of a bearish divergence pattern on H1 timeframe making 109 pips in 2 days.
How To Double The Account Every Month With This Trading System?
First let’s consider the aggressive approach. In the first trade our stop loss was 15 pips. Suppose we had $1,000 in our account as equity. If we had made the first trade with just 0.3 lot, our risk would have be $45. So our risk for this trade comes out to be $45 or in percentage terms we are only risking 4.5% of our account on this trade. We made 250 pips. Since we had traded with 0.3 lot, making 250 pips translates into $750. So you can see with one good trade we made a gain of 75% in just 2 days.
In the second trade our stop loss was 20 pips. Now we had $1,750 in our account, we could have traded with 0.4 lot. Our risk would have been again 4.5%. We made 109 pips which translates into $436. So we made a total profit of $750+$436= $1,186 in 4 days. This gives us a return of 118.6%.
Now it all depends on you how much risk you want to take. Since I have been trading with my system for a long time, I have much more confidence in it plus I know how it works. I would have taken the first aggressive approach. However, you need to be conservative in the beginning. You could have used 0.1 lot in the first trade. It would have meant a risk of just 1.5%. Your risk for the first trade would have been just $15. You would have made $250 in the first trade and $109 in the second trade giving you a total of $359. This translates into making a gain of 35.9% in just 4 days.
Important Tips
When price makes a new move, it will try to make a retracement and come within 5-15 pips of the top or the bottom. On the 15 minute chart, this is the time to make the entry. This retracement always takes place. I will need to use the Elliott Wave Analysis to explain that we will enter on wave 2. Wave 1 is the opening impulse wave which shows that a new trend is in place . Wave 2 is a corrective wave or what we call the retracement. Wave 3 is the longest impulse wave. Wave 4 is another corrective wave or is a retracement while wave 5 is the last impulse wave before the new trend sets in in the opposite direction. At the end of wave 5, you will spot the divergence pattern appearing on the chart. More on that in a future post.
I always enter when the trendline gets broken in the direction of the planned trade plus when the Stochastic is in the overbought condition on M15 incase of a short trade and it is oversold on M15 in case of a long trade. Most of the time I am able to enter with a stop loss which is below 20 pips. Sometimes I miss it. When I can’t get a stop loss lower than 20 pips, I skip the trade. Everyday market moves up and down. Everyday will bring a new opportunity to make pips. You should always keep the risk as much low as possible. Go for a trade when the reward/risk ratio is higher than 3:1. With my system you will be able to achieve this reward/risk ratio with a low risk.
So basically we enter on one divergence signal and exit on the next divergence signal.The crux of this system lies in finding a very low risk entry for your trade. You can also read my post on how to use this same Forex Divergence System for trading on H4 timeframe. Now it is a good idea to trade alongside professional traders. Their professional daily and weekly market commentary can help you a lot in knowing important areas of support and resistance where the currency pair will rebound. Forex Mentor PRO is a good service that is run by two professional forex traders. However, they use a different system. They try to trade on the pullbacks when the trend is established. The quality of the market commentary is good and you can try them RISK FREE for 7 days to see if it works for you or not. There are many educational videos that you can watch during this 7 day trial period.
where can I download the EBook?
where is the download link boss.
There is no download. This is the first post in a series of posts that explains my swing trading system in detail. In this post, I explain how to use my swing trading system on H1 timeframe. In next posts, I will explain how I use this same swing trading system on H4 and D1 timeframes. I also use the same system for scalping. In another post, I will explain in great detail how I use the same system for scalping. Read this post a number of times as I have written it in great detail. If you are new to the concept of divergences, you should click on the link that I have provided in the beginning of this post and download the PDF that explains divergence in great detail. After that you should read this post again. I hope this helps.
Best
Hassam
How much start up money will I need to SUCESSFULLY trade forex?
You can start with $100. If you have the skill to make 100% ROI, you can turn this $100 into $200 in one month. If you consistently make 100% ROI per month, this much you can make:
1st Month: $200
2nd Month: $400
3rd Month: $800
4th Month: $1600
5th Month: $3200
6th Month: $6400
7th Month: $12800
8th Month: $23600
9th Month: $47200
10th Month:$94400
11th Month:$188800
12th Month:$377600
13th Month:$755200
14th Month:$1511400
So after 14th month, you should be having $1.5 million in your trading account. The most important thing is the skill. Capital is not important. You should focus on learning forex trading and mastering the skill of making at least 100% ROI per month. Rest is simple!
Inspiring system, clear presentation. Thank you, Hassam!
I have explained my system in detail above. I have also included 2 PDFs that explain in detail candlesticks, moving averages and divergences. Read this post fully. I have explained everything in detail. People email me about the MACD indicator that I use. It is a standard MCAD indicator. The only difference is that it changes color when the price momentum increases or decreases. Price momentum is measured by the difference in the 2 EMAs. You can download this MACD_ColorHist_Alert ndicator below. There are many indicators listed on this page. You will find it 13 positions above the last indicator listed on this page.
http://www.forexfactory.com/misc.php?do=showattachments&t=211188&hideimg=1&page=2
Now this is a MQL4 file. If your MT4 platform has automatically upgraded to Build 600, you will need an ex4 file in addition to the mq4 file in order for this indicator to work. Use the MQL4 to EX4 compiler below:
http://trading-academy.ch/mql4-ex4-compiler/
All the instructions on how to use this MQL4 to EX4 compiler are explained in a very easy manner on this page.
Please feel free to leave your questions on this page about my Swing Trading System. I would love to answer your questions.
Best
Hassam
Can ‘be used for binary options? how long should the operation?
I have described the Forex Binary Options Post in a different post in great post. Please read that.